
Wednesday, April 27
I'm sorry I'm not here to welcome you back from spring break. Some kind of creature caught me and has taken my voice. I expect I will return tomorrow (and hope you will be kind if I talk like a cartoon character.)
I want to remind everyone how to do what we did before break with graphs and charts.
I'm sorry I'm not here to welcome you back from spring break. Some kind of creature caught me and has taken my voice. I expect I will return tomorrow (and hope you will be kind if I talk like a cartoon character.)
I want to remind everyone how to do what we did before break with graphs and charts.
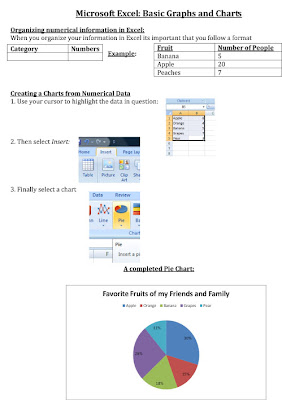
Please create a graph using the following data: THIS SHOULD BE A PIE CHART PLEASE!
- Use the following data to create a NEW pie chart
- 14 people like apples, 23 people like bananas, 7 people like raspberries, 2 people like pears and 9 people like strawberries
- Your chart will need a column for numbers of people, a column for apples, one for bananas, one for raspberries, one for pears and one for strawberries
- Save this as your name 4-26-11a
2. Please create ANOTHER graph about anything you want.
- You can make up the data and have as many categories as you like. (I suggest approximately 5 categories, don't forget you need numbers!). So DON'T ASK A YES/NO QUESTION!
- REMEMBER to organize the data the same way it was organized in the example above.
- You don't HAVE to do a pie chart, you can do any kind of chart you want
- Save this as your name 4-26-11b
3. Email
Email BOTH assignments to me by the end of the period!
If you are confused, click here:
http://www.gcflearnfree.org/excel2007/16.1
There is a video on page 2 of this lesson that might be helpful to watch.
If you are confused, click here:
http://www.gcflearnfree.org/excel2007/16.1
There is a video on page 2 of this lesson that might be helpful to watch.
Email that to me as well.
Thursday, April 28
Well, I think you've waited long enough... Welcome to PowerPoint!
Some of you probably already have had some PowerPoint experience. It's still a good idea to get a little refresher on the basics.
Please do the following lessons today. Next week we'll get into some of the more exciting stuff.
http://www.gcflearnfree.org/powerpoint2007/1
http://www.gcflearnfree.org/powerpoint2007/2
http://www.gcflearnfree.org/powerpoint2007/3
http://www.gcflearnfree.org/powerpoint2007/4
Please do the challenge for each of the four lessons in ONE PP presentation. That means you will email me only ONE presentation with all 4 challenges included in it.
THANKS!
Friday, April 29
Mock RegentsDay


